Largest Contentful Paint (LCP) is a member of the new Core Web Vitals released by Google this May. The goal of the metrics is to measure the load time of the main content.
More basically:
Does the biggest thing on the screen load quickly?
Example
Here's a bunch of very large images curtesy of NASA and SpaceX:





Because these images are so large, they slow down the rendering of the page.
How is LCP calculated?
There's no complex formula for Largest Contentful Paint.
It is simply the render time for the largest block of text or image visible within the viewport.
This result should be within the ranges below:
Which elements impact LCP?
The largest text or image within the viewport is what is measured.
This means a few things:
- LCP closely resembles the perceived load time for most users.
- As your design changes, the tracked element can change. This means mobile vs. desktop may track different elements.
- Prioritize load times for elements in the initial viewport as they will have the biggest impact.
How can I debug LCP issues?
Finding your LCP element
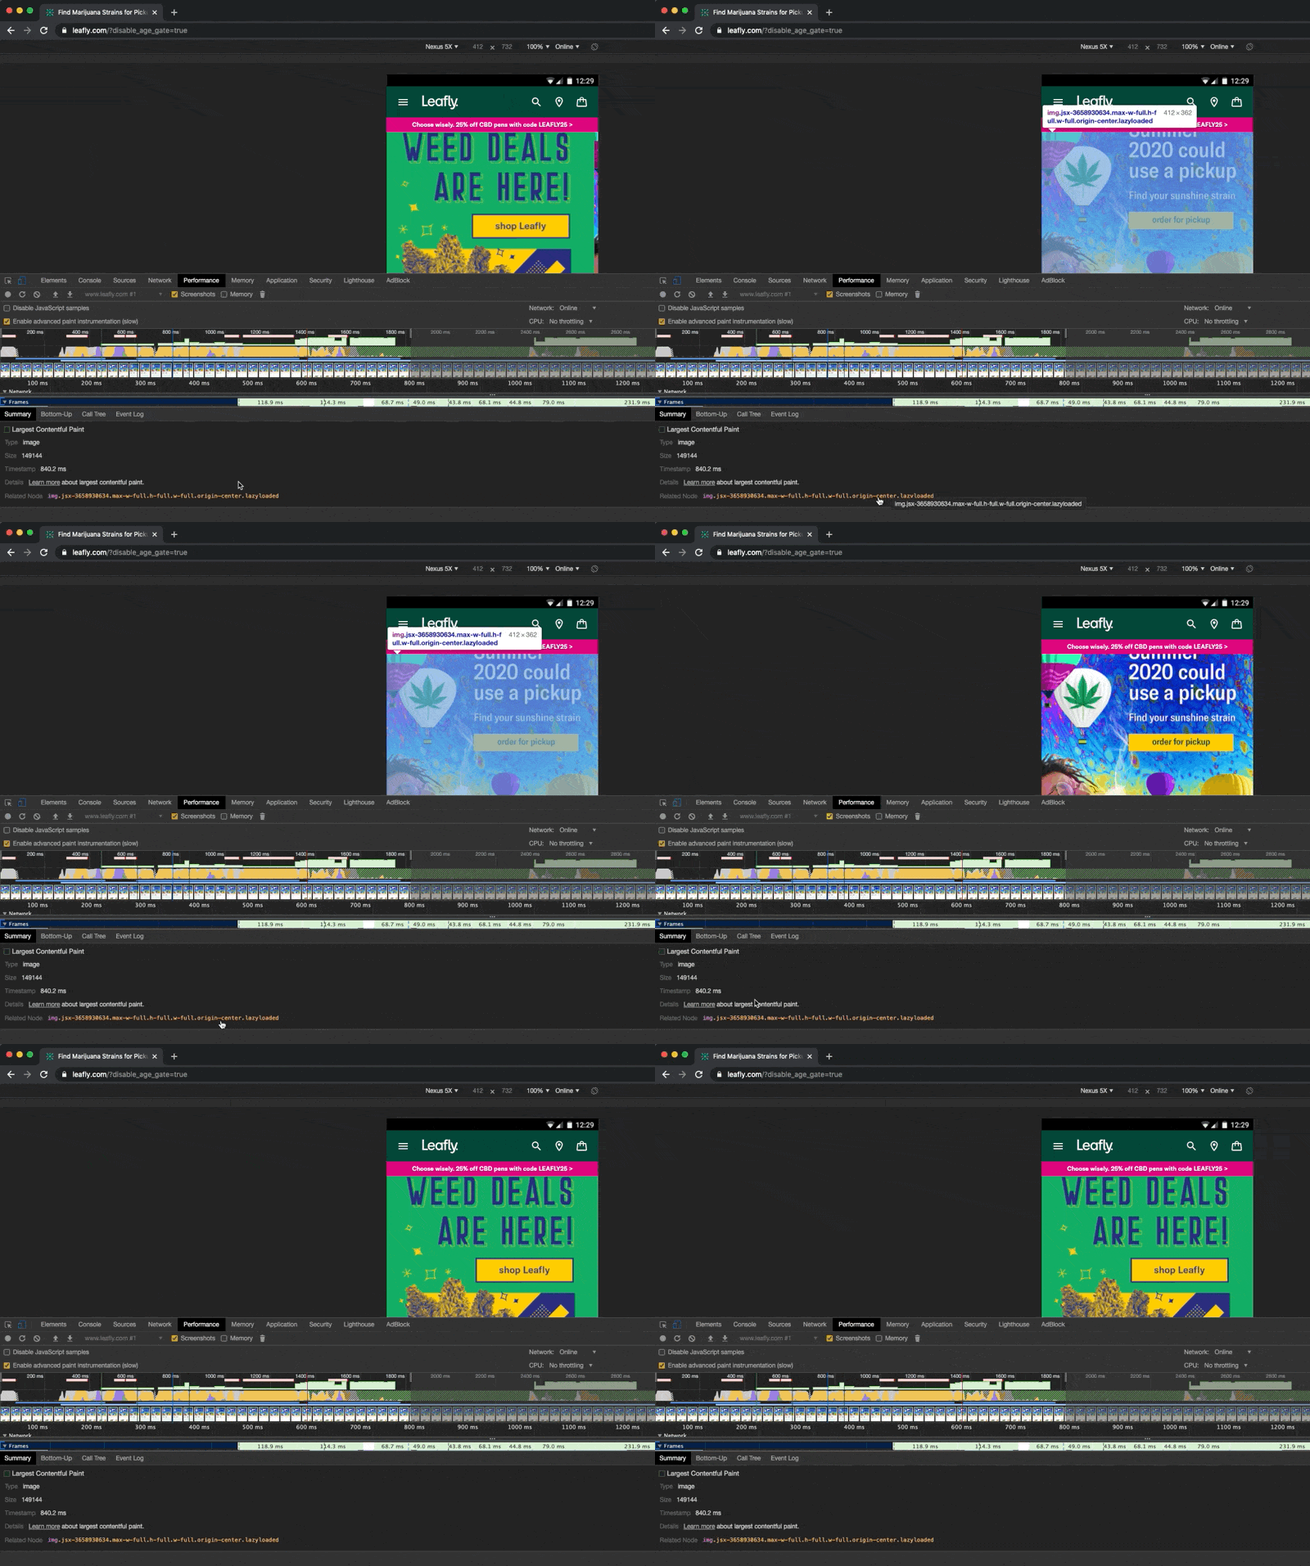
If you can't spot your LCP target element by eye, the Chrome profiler built into the developer tools can help.
By checking the box for Enable advanced paint instrumentation, the profiler will mark elements that cause CLS issues as well as the target for your Largest Contentful Paint.
Quick fixes for LCP
- Focus on improving Time to First Byte (TTFB). The faster your server responds, the faster the main content can render.
- Lazy load all images not in the initial viewport.
- Serve correctly sized images for the viewport size.
- Anything that improves First Contentful Paint (FCP) should improve LCP.
How can I track my LCP score?
There are currently four ways to track your Web Vitals:
- Page audits (Lighthouse and PageSpeed Insights)
- A Chrome extension
- Google Search Console
- Manual tracking
Read our guide on tracking your site's vitals.
